Salt Lake City is a hot, hot town. And we’re not talking about the nightlife or downtown’s envious post-pandemic recovery.
We’re talking extreme heat. Like, temperatures that can get 15 degrees hotter in any of the urban heat islands near a freeway, near downtown and in the neighborhoods to the southwest of downtown.
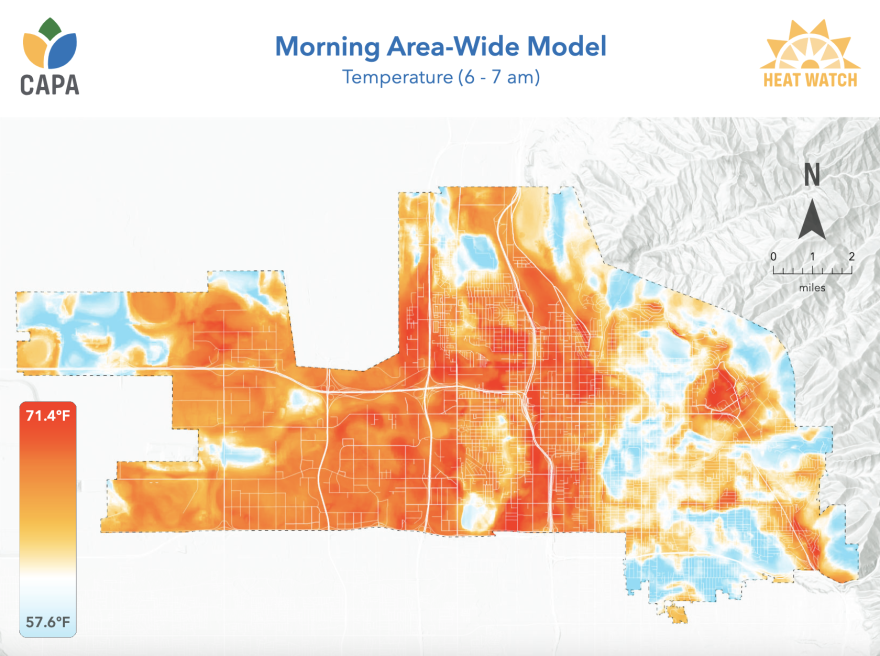
New hyperlocal heat maps from a National Oceanic and Atmospheric Administration-funded study show where the city’s hot spots are — generally anywhere with lots of asphalt and few trees. Temperatures tend to get hotter on the west side of town, with State Street serving as a loose dividing line.
Being able to point to this data confirms what people in these neighborhoods have long felt, said Rowland Hall biology teacher Rob Wilson, who led local volunteer mapping efforts.
“A lot of the phenomena are not very visible. You can't see heat. You can see the consequences of it … but you can't see it. And our maps make it visible.”

Wilson said it’s easy to spot overlap between the hotter parts of the heat island maps and historical maps that show how discriminatory housing practices, such as redlining, racially segregated some parts of the city. Nationwide, those policies often meant neighborhoods with more people of color got fewer trees and less green space than other neighborhoods.
“What it tells me is that neighborhoods that historically have been overlooked now have a greater heat burden,” Wilson said. “They're going to have more exposure to extreme heat than other neighborhoods.”
Additional heat islands centered on the University of Utah campus and shopping districts in the city’s east side foothills further illustrate how heat impacts aren’t solely tied to topography, Wilson said. The additional asphalt from Salt Lake City’s extra-wide streets likely doesn’t help either.
But he said the choices the city makes going forward could help reverse this damage.
For example, he said, Salt Lake City could target its urban forest plan to the places that would benefit most from more tree cover. Help residents install light-colored roofs that absorb less heat. Put up shades over playgrounds.
Morgan Zabow, NOAA’s community heat and health information coordinator, said it’s critical for city leaders to have this type of detailed information to know exactly where to direct their cooling efforts, especially as climate change ramps up heat waves in Utah.
“It's so important to be addressing this right now because we know that temperatures are only going to be getting hotter and we know that heat-related deaths are preventable with proper planning.”
Heat kills more Americans each year than any other weather event, she said, and that 15-degree temperature difference could be a matter of life and death for people who live or work in the city’s hot spots.
Salt Lake City is one of 19 communities nationwide that mapped their urban hot spots this year as part of a campaign funded by NOAA and analyzed by CAPA Strategies, a climate-focused data analytics firm.
Locally, the mapping project was a joint effort between the city, Utah State University’s Utah Climate Center, the Natural History Museum of Utah and the Rowland Hall school. It involved 42 volunteers driving across the city in cars equipped with heat and humidity sensors to capture more than 58,000 data points in the morning, afternoon and evening hours of a hot July day.
On the day of the study, evening temperatures across Salt Lake City ranged from 95.5 degrees to 81.3 degrees. The morning readings ranged from 71.4 degrees to 57.6 degrees.

In parts of town where temperatures don’t dissipate much overnight, NOAA’s Zabow said, heat waves could easily put people in danger — especially at-risk groups, such as young children, older adults and those experiencing homelessness.
“It gets really scary when you aren't able to have that cooling relief at night,” she said. “If you're sleeping in temperatures over 80 degrees Fahrenheit, that's really not good for your body.”
This type of detailed mapping is a necessary step in the broader movement toward environmental justice, Zabow said. The NOAA effort is part of the Biden administration’s push to ensure climate solutions go toward historically disadvantaged communities, known as the Justice40 Initiative.
Wilson of Rowland Hall hopes the hyperlocal data will make it easier for Salt Lake City to direct more of its funding — and get more outside funding — to support projects that’ll make an impact.
“You can say, ‘Here's proof that we have a heat island problem.’ And we know from weather records that our summers are getting longer and hotter, and we're going to get more common, more frequent, more severe, more long-lasting heat waves,” Wilson said. “So we're anticipating a more serious problem, and we know where those problems are going to be the worst.”
In addition to providing data for city leaders, getting the word out about heat islands could also help more residents find information on how they can protect themselves and their neighbors.
For those interested in getting involved in the city’s response to the heat maps, The Natural History Museum of Utah will host a public presentation and discussion on Nov. 5.


